(262) 710-2826
Solid State Frequency Converter
Solid State Specifications
Rotary Frequency Converter
Design Frequency Converters
About Us
Blog
Contact Us
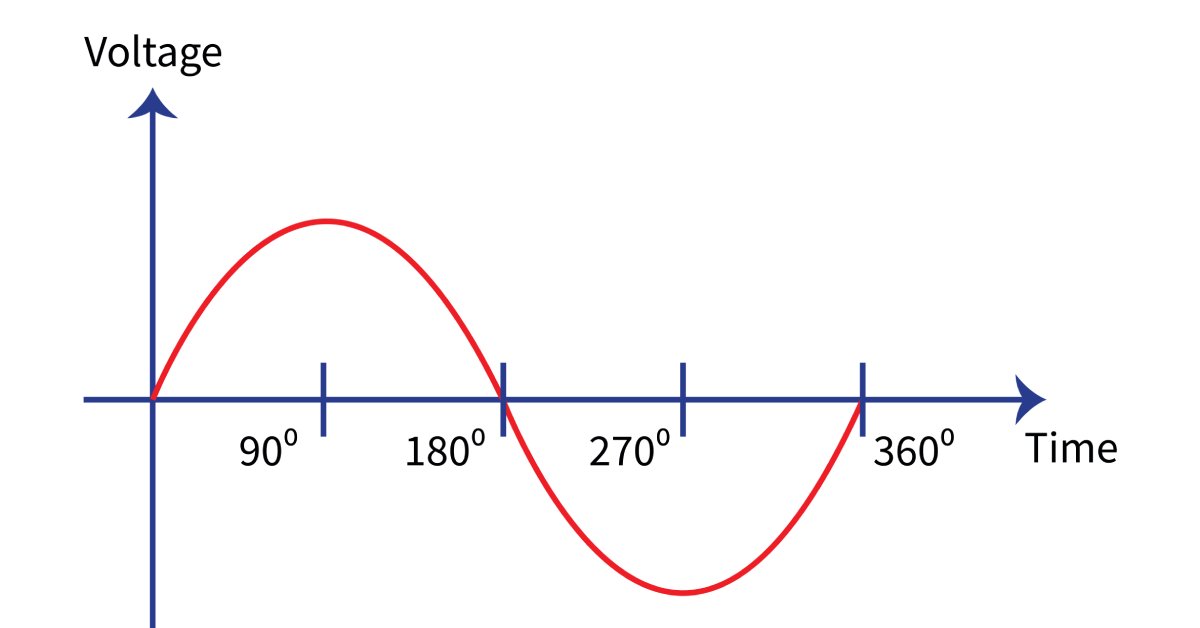
5 Advantages of Using Single-Phase Power
by
KateR
|
Oct 21, 2024